I once saw a low unit price and felt like I’d found a bargain. Then the “extras” showed up—freight, duties, broker fees, and small charges I didn’t know to ask about. The question isn’t “What’s the unit price?” It’s “What will this order really cost once it’s in my hands?”
Total landed cost adds up product cost, freight, duties, taxes, insurance, and destination fees. It’s the most reliable way to compare local and overseas quotes because it captures the true spend—not just the factory price.
I almost stopped after learning the definition. But the real value is understanding the hidden cost drivers—because that’s where most sourcing decisions go wrong.
Why unit price is misleading?
I accepted a cheap quote once and felt confident I’d “won” the negotiation. Then the add-on costs arrived in layers, and I realized I had only priced the product—not the purchase.
Unit price covers the lanyard itself. It often excludes freight, duties, taxes, customs clearance, and destination handling. Without the full picture, a “cheap” quote can become an expensive order.
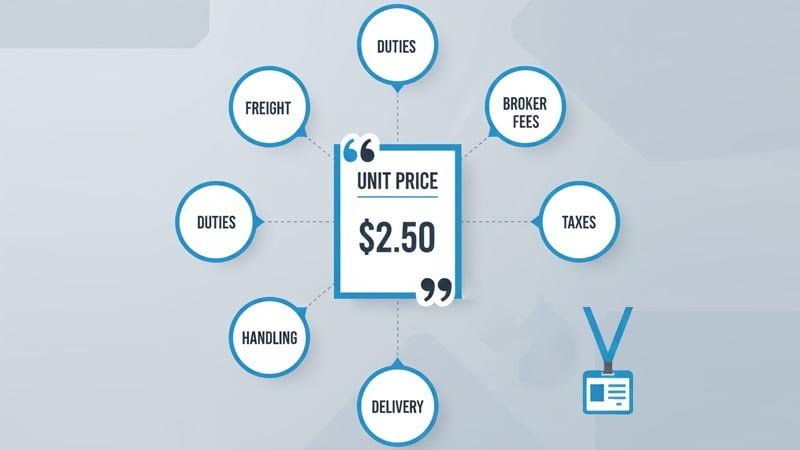
Unit price is only one component of the sourcing equation. I once ordered 1,000 lanyards at $0.50 each, so the product subtotal looked like $500. After that came $300 in freight, $100 in duties/taxes, and $50 in handling and processing fees. The real total was $950—not $500.
Since then, I ask for an itemized breakdown from supplier to delivery point. I clarify freight mode (sea, air, courier), volumetric weight assumptions, and destination charges such as port/terminal fees and customs brokerage. I also confirm the Incoterms (EXW, FOB, CIF, DDP), because they determine who pays which leg of the journey. With that full view, I can fairly compare a local quote at $1.20/pc against an overseas quote that looks like $0.95/pc after landed costs are included. The goal is simple: remove surprises before the PO is issued.
Define Total Landed Cost?
The first time I heard “landed cost,” it sounded like jargon. What I needed was a single number I could trust—and a clear way to build it.
Total landed cost is the sum of product price plus all shipping, insurance, duties, taxes, and clearance/handling fees required to deliver goods to your chosen destination. It shows what you truly pay to receive the order.
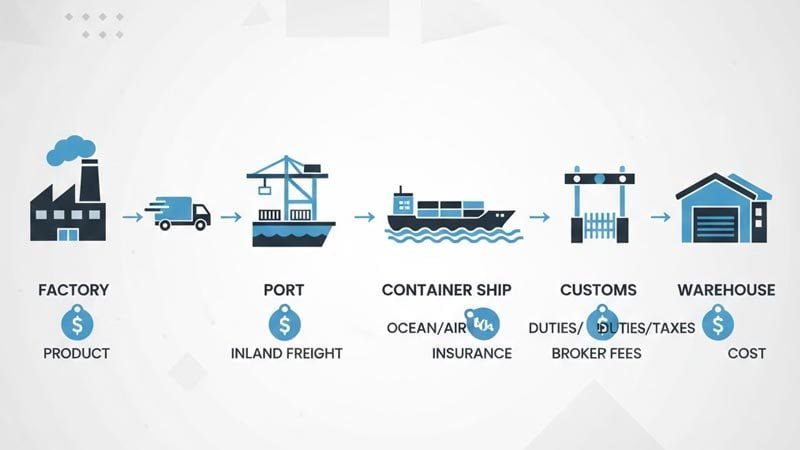
In practice, total landed cost typically includes six core components. First is the product price. Second is inland freight (factory to port/airport, or to a domestic carrier pickup point). Third is international freight (ocean or air). Fourth is insurance (sometimes optional, but often recommended for higher-value shipments). Fifth is customs duties and import taxes (country-specific and classification-dependent). Sixth is destination charges—port/terminal handling, documentation, and customs broker fees.
Two additional items often matter in global B2B sourcing: currency conversion/bank fees and quality-related costs (sampling rounds, third-party inspection, or rework). When I track landed cost, I keep it in a simple comparison table and label whether each line is per-piece or per-order:
| Cost Item | Local | Overseas |
|---|---|---|
| Product Price | $1.20/pc | $0.50/pc |
| Inland Freight | $0.10/pc | $0.05/pc |
| Sea Freight | – | $0.15/pc |
| Insurance | – | $0.02/pc |
| Duties and Taxes | – | $0.08/pc |
| Port and Broker Fees | – | $0.03/pc |
| Total Landed Cost | $1.30/pc | $0.83/pc |
I convert everything into a comparable basis—usually cost per piece—so I can compare options directly. I update the table each time I receive new quotes or new freight assumptions, because shipping and duty treatment can change over time and by destination.
Cost breakdown: Local vs Overseas?
When I had multiple quotes in front of me, I realized I needed a consistent format. Without a side-by-side breakdown, it’s easy to compare the wrong numbers.
A structured breakdown separates product pricing from logistics and import costs. It helps you see exactly where local and overseas suppliers differ—and which line items actually drive the outcome.
I build a simple table and force every quote into the same categories. I also label what’s per piece versus per order, so I don’t accidentally “hide” setup fees inside unit pricing. Here’s the structure I use:
| Item | Local Print | Overseas Import |
|---|---|---|
| Unit Price | $1.20/pc | $0.50/pc |
| Setup Fee | $50/order | $100/order |
| Minimum Order Qty | 100 pcs | 500 pcs |
| Freight | $0.10/pc | $0.20/pc |
| Customs Duties | – | $0.08/pc |
| Insurance & Fees | – | $0.05/pc |
| Total Landed Cost | $1.30/pc | $0.83/pc |
From there, I sanity-check the assumptions behind each line. For local suppliers, I confirm whether “freight” is courier shipping or local delivery. For overseas imports, I confirm if the freight estimate is based on carton size and volumetric weight, and whether destination fees (brokerage, documentation, terminal handling) are included. I also watch MOQ closely: an overseas quote can look great but still cost more overall if it forces higher inventory, storage, and cash tied up in stock.
Key drivers: quantity, complexity, lead time, freight?
I used to think price was the only variable. Then I watched the same product swing from “cheap” to “expensive” simply because the order size and shipping mode changed.
Order quantity, design complexity, lead time, and freight mode are the main landed-cost drivers. They can materially change total cost and should be evaluated together—not in isolation.
In real sourcing decisions, these four drivers usually move the result:
-
Quantity
-
Higher quantities reduce unit cost and amortize fixed costs.
-
Lower quantities make setup fees, freight minimums, and handling charges more painful per piece.
-
-
Complexity
-
Simple designs (single color, basic attachments) are easier to price and control.
-
Full-color printing, special materials, and multiple attachments can add setup cost, sampling time, and defect risk.
-
-
Lead Time
-
Rush timelines often trigger premium production or air freight.
-
Standard lead times enable more cost-efficient planning and shipping.
-
-
Freight Mode
-
Sea freight is cost-efficient but slower and more planning-dependent.
-
Air or courier is faster but can be several times higher—especially when volumetric weight applies.
-
To keep the conversation practical, I map each driver from low impact to high impact:
| Driver | Low Impact | High Impact |
|---|---|---|
| Quantity | 100 pcs | 10,000 pcs |
| Complexity | Single color | Full color |
| Lead Time | Standard | Express |
| Freight Mode | Sea (30 days) | Air (5 days) |
Then I test scenarios by plugging real quotes into the landed-cost table. A small rush order shipped by air can erase any unit-price advantage. A planned bulk order shipped by sea can flip the outcome in favor of overseas manufacturing.
Breakeven thinking?
Once I stopped guessing and started modeling, sourcing decisions got easier. The breakeven point gave me a defensible answer I could share internally.
Breakeven analysis identifies the order quantity where local and overseas total costs are equal. Above that quantity, one option becomes consistently cheaper—assuming the same specs and service level.
I use a clean breakeven model based on total cost (not just unit price):
-
Local total cost = Local setup fee + (Local landed cost per piece × Q)
-
Overseas total cost = Overseas setup fee + (Overseas landed cost per piece × Q)
Breakeven quantity is where the two totals match:
Breakeven Q = (Overseas setup – Local setup) / (Local landed per pc – Overseas landed per pc)
Example:
| Parameter | Value |
|---|---|
| Local setup fee | $50 |
| Overseas setup fee | $100 |
| Setup fee difference | $50 |
| Local landed cost per piece | $1.30 |
| Overseas landed cost per piece | $0.83 |
| Per-piece cost difference | $0.47 |
Breakeven Q = $50 / $0.47 ≈ 107 pcs.
That means if I order more than ~107 pieces (with the same specs and assumptions), overseas becomes cheaper on total landed cost. I rerun this calculation any time freight rates, duties, or lead-time requirements change—because those variables can shift the breakeven point quickly.
Scenarios?
Not every order is the same. I needed a simple playbook that matched common B2B buying situations—events, replenishment, trials, and rushes.
Different scenarios—trial orders, large events, last-minute requirements, or planned restocks—can change the best sourcing choice. Matching the scenario to the right supply route saves time and cost.
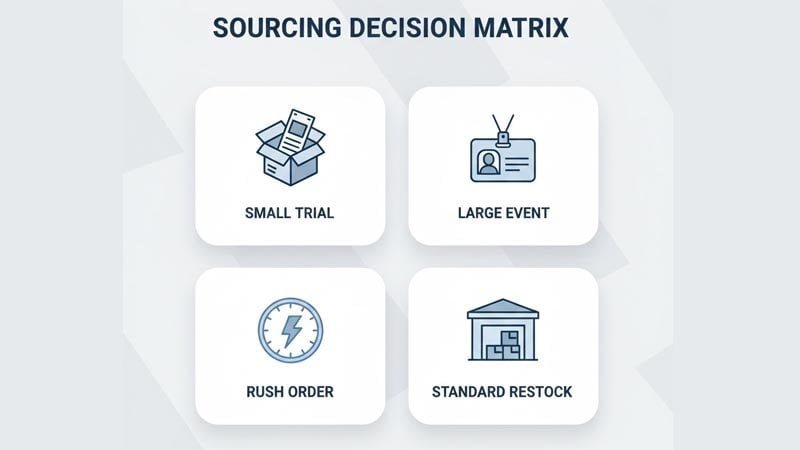
I typically map sourcing decisions into four scenarios:
-
Small Trial (100 pcs)
-
Local often wins: low complexity, minimal logistics, faster turnaround.
-
-
Large Event (5,000 pcs)
-
Overseas often wins: scale reduces unit cost and spreads fixed fees.
-
-
Rush Order (200 pcs, 2 weeks)
-
Local usually wins: fewer customs variables and less deadline risk.
-
-
Standard Restock (1,000 pcs, 6 weeks)
-
Compare both: overseas may win, but only if freight mode and landed fees stay under control.
-
I keep it summarized in a quick decision table:
| Scenario | Best Option | Reason |
|---|---|---|
| Small Trial | Local | Low qty, fast, minimal fees |
| Large Event | Overseas | High qty, lower unit cost |
| Rush Order | Local | Short lead time, lower risk |
| Standard Restock | Overseas | Better economics if planned |
The key is to price the scenario you’re actually in—not the scenario you wish you were in. Lead time and freight choice can change the result as much as the factory price.
Common traps?
I learned that most “bad deals” don’t look bad on the quote. They look bad after the shipment is moving—when changes are expensive and time is tight.
Common traps include hidden fees, quality gaps, MOQ-driven overbuying, currency swings, lead-time overruns, and miscommunication. A simple checklist prevents most of them.
Here are six traps I watch in global B2B sourcing:
-
Hidden fees
-
Customs brokerage, documentation, terminal handling, and local delivery charges.
-
-
Quality gaps
-
Color mismatch, print misalignment, weak stitching, or attachment issues that create rework or replacement costs.
-
-
MOQ mismatch
-
A low unit price that forces higher inventory can increase total cost once storage and cash flow are considered.
-
-
Currency risk
-
Exchange rates and bank fees can change your final cost, especially on repeat orders.
-
-
Lead time overruns
-
Delays may trigger air freight, expedited production, or event-impact costs.
-
-
Communication gaps
-
Ambiguous specs lead to wrong width, wrong material, wrong attachment, or incorrect packaging.
-
I track these in a simple prevention checklist:
| Trap | How to Avoid |
|---|---|
| Hidden Fees | Request an itemized landed-cost list |
| Quality Gaps | Approve pre-production samples; consider inspection |
| MOQ Mismatch | Model inventory and cash impact |
| Currency Risk | Confirm currency terms; factor bank fees |
| Lead Time Overruns | Build buffer time; confirm production schedule |
| Communication Gaps | Use a clear spec sheet and artwork proof process |
This checklist doesn’t eliminate risk, but it reduces preventable mistakes and turns “unknown unknowns” into manageable line items.
Checklist?
Once I built a repeatable process, sourcing stopped feeling like guesswork. A simple checklist made decisions faster—and easier to defend.
A final checklist ties together quotes, landed-cost breakdowns, breakeven modeling, scenarios, and risk traps. It helps you choose the best option with confidence.
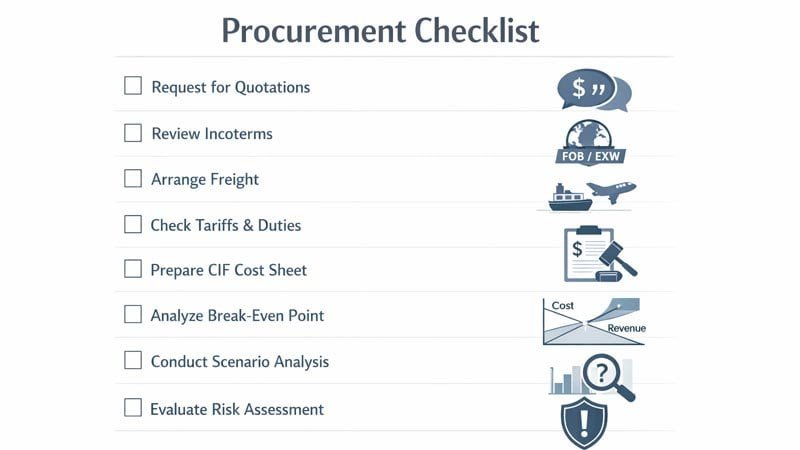
My checklist covers the steps I use on every lanyard sourcing decision:
-
Collect unit price, setup fees, and MOQ.
-
Confirm Incoterms (EXW/FOB/CIF/DDP) and what’s included.
-
Request freight options (sea, air, courier) with carton/volumetric assumptions.
-
Estimate duties/taxes and destination charges (broker, terminal, documentation).
-
Build a total landed cost table on a per-piece basis.
-
Run breakeven analysis using total-cost equations.
-
Map the order to a real scenario (trial, event, rush, restock).
-
Review the common traps and document mitigation steps.
I fill this out as soon as quotes arrive. If a supplier can’t provide the inputs, I treat that as a sourcing risk—not just a missing detail. With a complete landed-cost view, I can choose the right supply route based on cost, time, and risk—and explain the decision clearly to any stakeholder.
Conclusion
I now compare local and overseas sourcing using total landed cost, not unit price. When I itemize every line—product, freight, duties, fees, and risk—I can see the real winner and choose the best option with confidence, order after order.